California's 4th Congressional District, 2026
New district linesSign up to vote
Election results
90% reporting
| Candidate | Party | Votes | Percent |
|---|---|---|---|
| Eric JonesProjected winner, per civicAPI | Democratic | 133,646 | 52.5% |
| Mike Thompson | Democratic | 120,747 | 47.5% |
Who's running for California's 4th Congressional District in 2026?
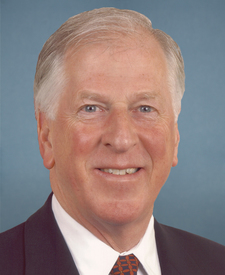
Eric Jones (D) faces Mike Thompson (D) on Tuesday, Nov. 3, 2026. Eric Jones has raised $18M to Mike Thompson's $5.5M, per FEC filings through Oct 14, 2026. This district's lines were redrawn for 2026.
Eric Jones
Democratic
| Candidate | Raised | Spent | Cash on hand |
|---|---|---|---|
| Eric Jones (D) | $18,058,057 | $16,516,978 | $1,541,079 |
| Mike Thompson (D) | $5,482,944 | $5,290,993 | $1,401,440 |
Campaign money as reported to the FEC through Oct 14, 2026. FEC filings: Eric Jones ↗ · Mike Thompson ↗
Past results
2024 general election
Held under different district lines
| Candidate | Party | Votes | Percent |
|---|---|---|---|
| Mike ThompsonWinner | D | 227,730 | 66.46% |
| John Munn | R | 114,950 | 33.54% |
Earlier results
2022 general election
Held under different district lines
| Candidate | Party | Votes | Percent |
|---|---|---|---|
| Mike ThompsonWinner | D | 176,900 | 67.80% |
| Matt Brock | R | 84,007 | 32.20% |
2020 general election
Held under different district lines
| Candidate | Party | Votes | Percent |
|---|---|---|---|
| Tom McClintockWinner | R | 247,291 | 55.95% |
| Brynne S. Kennedy | D | 194,731 | 44.05% |
New district lines for 2026
Drawn by Proposition 50, approved by voters in November 2025. Source ↗
Find your district on the district map.