South Carolina's 6th District
Home to 762,934 people in parts of Charleston, Columbia and North Charleston and 89 other places across 14 counties. Represented by James E. Clyburn (D), projected to win re-election.
2026 election
Projected winner: Jim Clyburn
99% of the vote counted as of Nov 21, 2026. One other candidate got 0.1%. Full race →
Earlier results: 2024, 2022
Since the lines were redrawn for 2022.
2024
2 other candidates got 0.4% between them.
2022
One other candidate got 0.1%.
Your representative
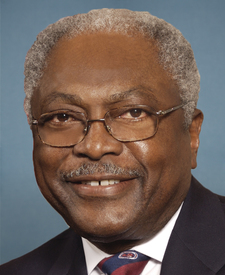
Clyburn's most recent votes
Who lives here
Compared with every congressional district.
- Median household income$58,458
Lower than 95% of districts. South Carolina $72,350, U.S. $81,604.
- Adults with a bachelor's degree or higher29.3%
Lower than 71% of districts. South Carolina 33.3%, U.S. 36.8%.
- Median age37.3 years
Lower than 75% of districts. South Carolina 40.7 years, U.S. 39.2 years.
- Living below the poverty line18.0%
Higher than 91% of districts. South Carolina 13.3%, U.S. 12.1%.
- Hispanic or Latino7.3%
Lower than 75% of districts. South Carolina 7.9%, U.S. 20.0%.
- Born outside the U.S.6.2%
Lower than 75% of districts. South Carolina 6.4%, U.S. 14.8%.
All demographics 6 more
- Population762,934
Lower than 66% of districts. South Carolina 5,478,831, U.S. 340,110,990.
- Veterans (adults)8.1%
Higher than 85% of districts. South Carolina 8.1%, U.S. 5.9%.
- White, not Hispanic42.0%
Lower than 74% of districts. South Carolina 61.6%, U.S. 56.3%.
- Black, not Hispanic43.7%
Higher than 96% of districts. South Carolina 23.3%, U.S. 11.7%.
- Asian, not Hispanic1.8%
Lower than 76% of districts. South Carolina 2.0%, U.S. 6.2%.
- Other races or more than one, not Hispanic5.3%
Higher than 51% of districts. South Carolina 5.1%, U.S. 5.8%.
Dots rank SC-6 among 435 districts. Census ACS 2024 ↗
Places in the district
Allendale County, Bamberg County, Calhoun County, Charleston County, Clarendon County, Colleton County, Dorchester County, Florence County, Hampton County, Jasper County, Orangeburg County, Richland County, Sumter County, Williamsburg County.
- Charleston (part)
- Columbia (part)
- North Charleston (part)
- Summerville (part)
- Sumter (part)
- Cayce (part)
- Orangeburg
- Forest Acres (part)
- St. Andrews (part)
- Hardeeville (part)
- Ladson (part)
- Lake City
- Dentsville (part)
- Walterboro
- Hollywood (part)
- Manning
- Ridgeland (part)
- Kingstree
- Denmark
- Bamberg
- Allendale
- Hampton
- Andrews (part)
- Ravenel
- Capitol View (part)
- St. George
- St. Matthews
- Estill
- Ridgeville
- Varnville
- Brookdale
- Fairfax
- Wyboo
- Meggett
- Holly Hill
- Lincolnville (part)
- Lakewood (part)
- Yemassee (part)
- Hopkins
- Branchville
- and 52 more
Sources: Census Bureau, FEC, state election offices, Clerk of the House; 2026 results as of November 21, 2026.