District of Columbia's Delegate to the House
Home to 702,250 people in all of Washington. Represented by Eleanor Holmes Norton (D).
The delegate sits in the House and votes in committee and on amendments, but not on passing bills.
Elections
Earlier results: 2024, 2022, 2020
The whole jurisdiction votes for this seat. Results since 2020.
2024
One other candidate got 0.6%.
2022
One other candidate got 0.8%.
2020
2 other candidates got 1.6% between them.
Your representative
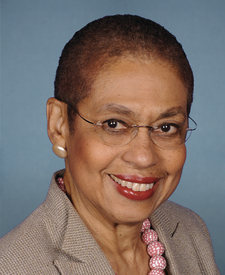
Norton's most recent votes
Who lives here
Compared with every congressional district.
- Median household income$109,707
Higher than 88% of districts. District of Columbia $109,707, U.S. $81,604.
- Adults with a bachelor's degree or higher65.5%
Higher than 99% of districts. District of Columbia 65.5%, U.S. 36.8%.
- Median age34.9 years
Lower than 92% of districts. District of Columbia 34.9 years, U.S. 39.2 years.
- Living below the poverty line17.3%
Higher than 88% of districts. District of Columbia 17.3%, U.S. 12.1%.
- Hispanic or Latino12.6%
Lower than 54% of districts. District of Columbia 12.6%, U.S. 20.0%.
- Born outside the U.S.15.5%
Higher than 63% of districts. District of Columbia 15.5%, U.S. 14.8%.
All demographics 6 more
- Population702,250
Lower than 97% of districts. District of Columbia 702,250, U.S. 340,110,990.
- Veterans (adults)3.1%
Lower than 86% of districts. District of Columbia 3.1%, U.S. 5.9%.
- White, not Hispanic36.2%
Lower than 80% of districts. District of Columbia 36.2%, U.S. 56.3%.
- Black, not Hispanic40.7%
Higher than 94% of districts. District of Columbia 40.7%, U.S. 11.7%.
- Asian, not Hispanic4.9%
Higher than 61% of districts. District of Columbia 4.9%, U.S. 6.2%.
- Other races or more than one, not Hispanic5.5%
Higher than 58% of districts. District of Columbia 5.5%, U.S. 5.8%.
Dots rank DC among 435 districts. Census ACS 2024 ↗
Places in the district
District of Columbia.
- Washington
Sources: Census Bureau, FEC, state election offices, Clerk of the House.