Wyoming's At-Large District
Home to 587,618 people in all of Cheyenne, Casper and Gillette and 202 other places across 23 counties. Represented by Harriet M. Hageman (R) until January; Chuck Gray (R) is the projected winner of the 2026 election.
2026 election
Open seat. Hageman won the U.S. Senate race.
Projected winner: Chuck Gray
84% of the vote counted as of Nov 21, 2026. Full race →
Earlier results: 2024, 2022, 2020
The whole state votes for this seat. Results since 2020.
2024
One other candidate got 0.6%.
2022
One other candidate got 2.3%.
2020
One other candidate got 0.2%.
Your representative
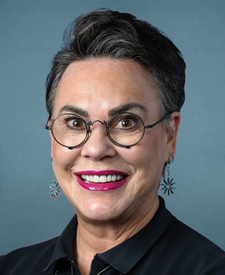
Rep. Harriet M. Hageman
Republican · in the House since 2023
Leaving in January: won the U.S. Senate raceHageman's most recent votes
Who lives here
Compared with every congressional district.
- Median household income$75,532
Lower than 61% of districts. Wyoming $75,532, U.S. $81,604.
- Adults with a bachelor's degree or higher32.3%
Lower than 60% of districts. Wyoming 32.3%, U.S. 36.8%.
- Median age40.2 years
Higher than 59% of districts. Wyoming 40.2 years, U.S. 39.2 years.
- Living below the poverty line10.1%
Lower than 68% of districts. Wyoming 10.1%, U.S. 12.1%.
- Hispanic or Latino11.1%
Lower than 60% of districts. Wyoming 11.1%, U.S. 20.0%.
- Born outside the U.S.3.5%
Lower than 91% of districts. Wyoming 3.5%, U.S. 14.8%.
All demographics 6 more
- Population587,618
Lower than 99% of districts. Wyoming 587,618, U.S. 340,110,990.
- Veterans (adults)8.1%
Higher than 85% of districts. Wyoming 8.1%, U.S. 5.9%.
- White, not Hispanic80.5%
Higher than 86% of districts. Wyoming 80.5%, U.S. 56.3%.
- Black, not Hispanic0.7%
Lower than 98% of districts. Wyoming 0.7%, U.S. 11.7%.
- Asian, not Hispanic0.9%
Lower than 93% of districts. Wyoming 0.9%, U.S. 6.2%.
- Other races or more than one, not Hispanic6.8%
Higher than 80% of districts. Wyoming 6.8%, U.S. 5.8%.
Dots rank WY-AL among 435 districts. Census ACS 2024 ↗
Places in the district
Albany County, Big Horn County, Campbell County, Carbon County, Converse County, Crook County, Fremont County, Goshen County, Hot Springs County, Johnson County, Laramie County, Lincoln County, Natrona County, Niobrara County, Park County, Platte County, Sheridan County, Sublette County, Sweetwater County, Teton County, Uinta County, Washakie County, Weston County.
- Cheyenne
- Casper
- Gillette
- Laramie
- Rock Springs
- Sheridan
- Green River
- Evanston
- Jackson
- Riverton
- Cody
- Rawlins
- Lander
- Powell
- Douglas
- Torrington
- Worland
- Buffalo
- Mills
- Wheatland
- Newcastle
- Bar Nunn
- Evansville
- Thermopolis
- Ranchettes
- Glenrock
- Kemmerer
- Lovell
- Afton
- Lyman
- Pinedale
- South Greeley
- Star Valley Ranch
- Saratoga
- Greybull
- Wright
- Fox Farm-College
- Lusk
- Basin
- Mountain View
- and 165 more
Sources: Census Bureau, FEC, state election offices, Clerk of the House; 2026 results as of November 21, 2026.