Wisconsin's 7th District
Home to 754,076 people in all of Wausau, Superior and Marshfield and 192 other places across 26 counties. Represented by Thomas P. Tiffany (R) until January; Michael Alfonso (R) is the projected winner of the 2026 election.
2026 election
Open seat. Tiffany ran for Governor of Wisconsin.
Projected winner: Michael Alfonso
89% of the vote counted as of Nov 21, 2026. One other candidate got under 0.1%. Full race →
Earlier results: 2024, 2022
Since the lines were redrawn for 2022.
2024
One other candidate got under 0.1%.
2022
One other candidate got under 0.1%.
Your representative
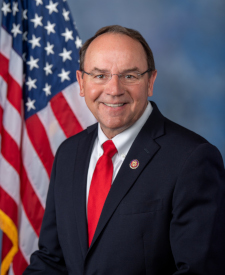
Rep. Thomas P. Tiffany
Republican · in the House since 2020
Leaving in January: ran for Governor of WisconsinTiffany's most recent votes
Who lives here
Compared with every congressional district.
- Median household income$73,003
Lower than 67% of districts. Wisconsin $77,488, U.S. $81,604.
- Adults with a bachelor's degree or higher27.0%
Lower than 79% of districts. Wisconsin 34.6%, U.S. 36.8%.
- Median age45.7 years
Higher than 97% of districts. Wisconsin 40.7 years, U.S. 39.2 years.
- Living below the poverty line9.8%
Lower than 72% of districts. Wisconsin 10.3%, U.S. 12.1%.
- Hispanic or Latino3.2%
Lower than 96% of districts. Wisconsin 8.4%, U.S. 20.0%.
- Born outside the U.S.2.4%
Lower than 96% of districts. Wisconsin 5.5%, U.S. 14.8%.
All demographics 6 more
- Population754,076
Lower than 74% of districts. Wisconsin 5,960,975, U.S. 340,110,990.
- Veterans (adults)7.2%
Higher than 74% of districts. Wisconsin 5.8%, U.S. 5.9%.
- White, not Hispanic88.7%
Higher than 98% of districts. Wisconsin 77.8%, U.S. 56.3%.
- Black, not Hispanic0.8%
Lower than 98% of districts. Wisconsin 5.9%, U.S. 11.7%.
- Asian, not Hispanic1.8%
Lower than 76% of districts. Wisconsin 3.1%, U.S. 6.2%.
- Other races or more than one, not Hispanic5.4%
Higher than 54% of districts. Wisconsin 4.8%, U.S. 5.8%.
Dots rank WI-7 among 435 districts. Census ACS 2024 ↗
Places in the district
Ashland County, Barron County, Bayfield County, Burnett County, Chippewa County, Clark County, Douglas County, Florence County, Forest County, Iron County, Jackson County, Juneau County, Langlade County, Lincoln County, Marathon County, Monroe County, Oneida County, Polk County, Price County, Rusk County, Sawyer County, St. Croix County, Taylor County, Vilas County, Washburn County, Wood County.
- Wausau
- Superior
- Marshfield
- River Falls (part)
- Weston
- Hudson
- New Richmond
- Tomah (part)
- Merrill
- Rice Lake
- Kronenwetter
- Rhinelander
- Antigo
- Ashland
- Rothschild
- Mosinee
- Medford
- Baldwin
- Stanley
- North Hudson
- Barron
- Bloomer
- Tomahawk
- Ladysmith
- Somerset
- Amery
- Osceola
- Maine
- Hayward
- Spooner
- Rib Mountain
- Park Falls
- Neillsville
- Abbotsford
- Cumberland
- St. Croix Falls
- Chetek
- Schofield
- Washburn
- Colby
- and 155 more
Sources: Census Bureau, FEC, state election offices, Clerk of the House; 2026 results as of November 21, 2026.