West Virginia's 1st District
Home to 861,893 people in all of Charleston, Huntington and Beckley and 260 other places across 28 counties. Represented by Carol D. Miller (R), projected to win re-election.
2026 election
Projected winner: Carol Miller
71% of the vote counted as of Nov 21, 2026. Full race →
Earlier results: 2024, 2022
Since the lines were redrawn for 2022.
2024
2 other candidates got under 0.1% between them.
2022
Your representative
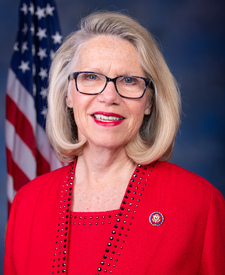
Miller's most recent votes
Who lives here
Compared with every congressional district.
- Median household income$56,624
Lower than 96% of districts. West Virginia $60,798, U.S. $81,604.
- Adults with a bachelor's degree or higher22.2%
Lower than 94% of districts. West Virginia 24.4%, U.S. 36.8%.
- Median age44.2 years
Higher than 95% of districts. West Virginia 42.9 years, U.S. 39.2 years.
- Living below the poverty line17.7%
Higher than 90% of districts. West Virginia 16.7%, U.S. 12.1%.
- Hispanic or Latino1.3%
Lowest of all districts. West Virginia 2.3%, U.S. 20.0%.
- Born outside the U.S.1.4%
Lower than 99% of districts. West Virginia 2.1%, U.S. 14.8%.
All demographics 6 more
- Population861,893
Higher than 94% of districts. West Virginia 1,769,979, U.S. 340,110,990.
- Veterans (adults)7.0%
Higher than 70% of districts. West Virginia 7.3%, U.S. 5.9%.
- White, not Hispanic89.8%
Higher than 99% of districts. West Virginia 88.9%, U.S. 56.3%.
- Black, not Hispanic3.5%
Lower than 74% of districts. West Virginia 3.1%, U.S. 11.7%.
- Asian, not Hispanic0.5%
Lower than 99% of districts. West Virginia 0.7%, U.S. 6.2%.
- Other races or more than one, not Hispanic4.9%
Lower than 57% of districts. West Virginia 5.1%, U.S. 5.8%.
Dots rank WV-1 among 435 districts. Census ACS 2024 ↗
Places in the district
Boone County, Braxton County, Cabell County, Calhoun County, Clay County, Fayette County, Gilmer County, Greenbrier County, Jackson County, Kanawha County, Lincoln County, Logan County, Mason County, McDowell County, Mercer County, Mingo County, Monroe County, Nicholas County, Pendleton County, Pocahontas County, Putnam County, Raleigh County, Roane County, Summers County, Wayne County, Webster County, Wirt County, Wyoming County.
- Charleston
- Huntington
- Beckley
- South Charleston
- St. Albans
- Bluefield
- Oak Hill
- Dunbar
- Hurricane
- Nitro
- Princeton
- Teays Valley
- Barboursville
- Point Pleasant
- Lewisburg
- Cross Lanes
- Ravenswood
- Welch
- Summersville
- Williamson
- Ripley
- Kenova
- Madison
- Fayetteville
- Milton
- Pea Ridge
- Winfield
- Hinton
- White Sulphur Springs
- Spencer
- Richwood
- Sissonville
- Ronceverte
- Eleanor
- Marmet
- Mullens
- New Haven
- Oceana
- Wayne
- Logan
- and 223 more
Sources: Census Bureau, FEC, state election offices, Clerk of the House; 2026 results as of November 21, 2026.