Washington's 2nd District
Home to 789,531 people in parts of Everett and Marysville, all of Bellingham and 64 other places across 5 counties. Represented by Rick Larsen (D), projected to win re-election.
2026 election
Projected winner: Rick Larsen
99% of the vote counted as of Nov 21, 2026. One other candidate got 0.4%. Full race →
Earlier results: 2024, 2022
Since the lines were redrawn for 2022.
2024
One other candidate got 0.3%.
2022
One other candidate got 0.2%.
Your representative
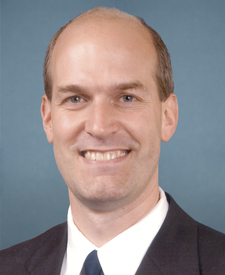
Larsen's most recent votes
Who lives here
Compared with every congressional district.
- Median household income$90,998
Higher than 68% of districts. Washington $99,389, U.S. $81,604.
- Adults with a bachelor's degree or higher38.8%
Higher than 65% of districts. Washington 41.0%, U.S. 36.8%.
- Median age40.8 years
Higher than 69% of districts. Washington 38.7 years, U.S. 39.2 years.
- Living below the poverty line10.5%
Lower than 63% of districts. Washington 9.9%, U.S. 12.1%.
- Hispanic or Latino14.0%
Lower than 50% of districts. Washington 15.0%, U.S. 20.0%.
- Born outside the U.S.13.8%
Higher than 59% of districts. Washington 16.1%, U.S. 14.8%.
All demographics 6 more
- Population789,531
Higher than 61% of districts. Washington 7,958,180, U.S. 340,110,990.
- Veterans (adults)8.1%
Higher than 85% of districts. Washington 7.3%, U.S. 5.9%.
- White, not Hispanic67.3%
Higher than 65% of districts. Washington 61.5%, U.S. 56.3%.
- Black, not Hispanic2.9%
Lower than 79% of districts. Washington 3.9%, U.S. 11.7%.
- Asian, not Hispanic7.3%
Higher than 75% of districts. Washington 10.6%, U.S. 6.2%.
- Other races or more than one, not Hispanic8.4%
Higher than 91% of districts. Washington 9.0%, U.S. 5.8%.
Dots rank WA-2 among 435 districts. Census ACS 2024 ↗
Places in the district
Island County, San Juan County, Skagit County, Snohomish County, Whatcom County.
- Everett (part)
- Bellingham
- Marysville (part)
- Edmonds
- Lynnwood
- Mount Vernon
- Oak Harbor
- Mukilteo
- Anacortes
- Lynden
- Ferndale
- Sedro-Woolley
- Burlington
- North Lynnwood (part)
- Stanwood
- Camano
- Lake Stickney
- Blaine
- Birch Bay
- Picnic Point
- Everson
- Friday Harbor
- Sudden Valley
- Coupeville
- Lake Goodwin
- Marietta-Alderwood
- Esperance
- Sumas
- Nooksack
- Woodway
- Meadowdale
- Peaceful Valley
- Warm Beach
- Big Lake
- Langley
- Geneva
- La Conner
- Freeland
- Concrete
- Kayak Point
- and 27 more
Sources: Census Bureau, FEC, state election offices, Clerk of the House; 2026 results as of November 21, 2026.