Vermont's At-Large District
Home to 648,493 people in all of Burlington, South Burlington and Rutland and 177 other places across 14 counties. Represented by Becca Balint (D), projected to win re-election.
2026 election
Projected winner: Becca Balint
93% of the vote counted as of Nov 21, 2026. 4 other candidates got 2.5% between them. Full race →
Earlier results: 2024, 2022, 2020
The whole state votes for this seat. Results since 2020.
2024
One other candidate got 0.3%.
2022
One other candidate got 0.4%.
2020
4 other candidates got 2.2% between them.
Your representative
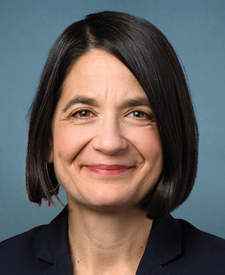
Balint's most recent votes
Who lives here
Compared with every congressional district.
- Median household income$82,730
Higher than 56% of districts. Vermont $82,730, U.S. $81,604.
- Adults with a bachelor's degree or higher45.1%
Higher than 78% of districts. Vermont 45.1%, U.S. 36.8%.
- Median age43.9 years
Higher than 93% of districts. Vermont 43.9 years, U.S. 39.2 years.
- Living below the poverty line9.0%
Lower than 79% of districts. Vermont 9.0%, U.S. 12.1%.
- Hispanic or Latino2.7%
Lower than 97% of districts. Vermont 2.7%, U.S. 20.0%.
- Born outside the U.S.4.5%
Lower than 85% of districts. Vermont 4.5%, U.S. 14.8%.
All demographics 6 more
- Population648,493
Lower than 99% of districts. Vermont 648,493, U.S. 340,110,990.
- Veterans (adults)5.7%
Lower than 55% of districts. Vermont 5.7%, U.S. 5.9%.
- White, not Hispanic89.3%
Higher than 99% of districts. Vermont 89.3%, U.S. 56.3%.
- Black, not Hispanic0.9%
Lower than 97% of districts. Vermont 0.9%, U.S. 11.7%.
- Asian, not Hispanic2.0%
Lower than 74% of districts. Vermont 2.0%, U.S. 6.2%.
- Other races or more than one, not Hispanic5.0%
Lower than 54% of districts. Vermont 5.0%, U.S. 5.8%.
Dots rank VT-AL among 435 districts. Census ACS 2024 ↗
Places in the district
Addison County, Bennington County, Caledonia County, Chittenden County, Essex County, Franklin County, Grand Isle County, Lamoille County, Orange County, Orleans County, Rutland County, Washington County, Windham County, Windsor County.
- Burlington
- South Burlington
- Rutland
- Essex Junction
- Barre
- Montpelier
- Winooski
- St. Albans
- Newport
- Bennington
- Brattleboro
- Middlebury
- Bellows Falls
- Vergennes
- Shelburne
- St. Johnsbury
- Swanton
- Morrisville
- North Bennington
- Springfield
- Milton
- Northfield
- Enosburg Falls
- Jericho
- Johnson
- Wilder
- Lyndonville
- West Brattleboro
- Poultney
- White River Junction
- Woodstock
- Fair Haven
- Manchester Center
- Windsor
- Randolph
- Orleans
- Manchester
- Bristol
- Ludlow
- West Rutland
- and 140 more
Sources: Census Bureau, FEC, state election offices, Clerk of the House; 2026 results as of November 21, 2026.