South Carolina's 5th District
Home to 782,718 people in part of Sumter, all of Rock Hill and Fort Mill and 80 other places across 10 counties. Represented by Ralph Norman (R) until January; Wes Climer (R) is the projected winner of the 2026 election.
2026 election
Open seat. Norman lost the primary for Governor of South Carolina.
Projected winner: Wes Climer
99% of the vote counted as of Nov 21, 2026. One other candidate got under 0.1%. Full race →
Earlier results: 2024, 2022
Since the lines were redrawn for 2022.
2024
One other candidate got 0.1%.
2022
One other candidate got under 0.1%.
Your representative
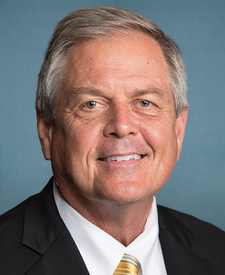
Rep. Ralph Norman
Republican · in the House since 2017
Leaving in January: lost the primary for Governor of South CarolinaNorman's most recent votes
Who lives here
Compared with every congressional district.
- Median household income$75,344
Lower than 61% of districts. South Carolina $72,350, U.S. $81,604.
- Adults with a bachelor's degree or higher30.8%
Lower than 65% of districts. South Carolina 33.3%, U.S. 36.8%.
- Median age40.1 years
Higher than 58% of districts. South Carolina 40.7 years, U.S. 39.2 years.
- Living below the poverty line11.6%
Higher than 50% of districts. South Carolina 13.3%, U.S. 12.1%.
- Hispanic or Latino6.5%
Lower than 79% of districts. South Carolina 7.9%, U.S. 20.0%.
- Born outside the U.S.5.8%
Lower than 76% of districts. South Carolina 6.4%, U.S. 14.8%.
All demographics 6 more
- Population782,718
Higher than 53% of districts. South Carolina 5,478,831, U.S. 340,110,990.
- Veterans (adults)8.1%
Higher than 85% of districts. South Carolina 8.1%, U.S. 5.9%.
- White, not Hispanic62.7%
Higher than 56% of districts. South Carolina 61.6%, U.S. 56.3%.
- Black, not Hispanic23.6%
Higher than 88% of districts. South Carolina 23.3%, U.S. 11.7%.
- Asian, not Hispanic2.3%
Lower than 68% of districts. South Carolina 2.0%, U.S. 6.2%.
- Other races or more than one, not Hispanic5.0%
Lower than 54% of districts. South Carolina 5.1%, U.S. 5.8%.
Dots rank SC-5 among 435 districts. Census ACS 2024 ↗
Places in the district
Cherokee County, Chester County, Fairfield County, Kershaw County, Lancaster County, Lee County, Spartanburg County, Sumter County, Union County, York County.
- Rock Hill
- Sumter (part)
- Fort Mill
- Tega Cay
- Gaffney
- York
- Lancaster
- Union
- Camden
- Clover
- Lake Wylie
- Chester
- Blythewood (part)
- Boiling Springs (part)
- Lugoff
- Winnsboro
- Bishopville
- Cowpens
- Great Falls
- Newport
- Blacksburg
- Kershaw
- Baxter Village
- Elgin
- India Hook
- East Camden
- Dalzell
- Lesslie
- East Gaffney
- Springdale
- Cherryvale
- Fort Lawn
- Elgin
- Jonesville
- Van Wyck
- Chesnee
- Privateer
- Heath Springs
- Riverview
- Campobello (part)
- and 43 more
Sources: Census Bureau, FEC, state election offices, Clerk of the House; 2026 results as of November 21, 2026.