South Carolina's 2nd District
Home to 764,414 people in parts of Columbia and North Augusta, all of Aiken and 58 other places across 5 counties. Represented by Joe Wilson (R), projected to win re-election.
2026 election
Projected winner: Joe Wilson
99% of the vote counted as of Nov 21, 2026. One other candidate got 0.1%. Full race →
Earlier results: 2024, 2022
Since the lines were redrawn for 2022.
2024
One other candidate got 0.2%.
2022
One other candidate got 0.1%.
Your representative
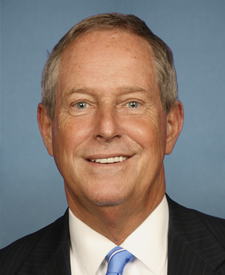
Wilson's most recent votes
Who lives here
Compared with every congressional district.
- Median household income$77,683
Lower than 55% of districts. South Carolina $72,350, U.S. $81,604.
- Adults with a bachelor's degree or higher37.7%
Higher than 61% of districts. South Carolina 33.3%, U.S. 36.8%.
- Median age40.2 years
Higher than 59% of districts. South Carolina 40.7 years, U.S. 39.2 years.
- Living below the poverty line11.4%
Lower than 52% of districts. South Carolina 13.3%, U.S. 12.1%.
- Hispanic or Latino7.6%
Lower than 74% of districts. South Carolina 7.9%, U.S. 20.0%.
- Born outside the U.S.6.8%
Lower than 72% of districts. South Carolina 6.4%, U.S. 14.8%.
All demographics 6 more
- Population764,414
Lower than 64% of districts. South Carolina 5,478,831, U.S. 340,110,990.
- Veterans (adults)8.7%
Higher than 91% of districts. South Carolina 8.1%, U.S. 5.9%.
- White, not Hispanic59.4%
Higher than 50% of districts. South Carolina 61.6%, U.S. 56.3%.
- Black, not Hispanic25.3%
Higher than 89% of districts. South Carolina 23.3%, U.S. 11.7%.
- Asian, not Hispanic2.5%
Lower than 64% of districts. South Carolina 2.0%, U.S. 6.2%.
- Other races or more than one, not Hispanic5.2%
Lower than 49% of districts. South Carolina 5.1%, U.S. 5.8%.
Dots rank SC-2 among 435 districts. Census ACS 2024 ↗
Places in the district
Aiken County, Barnwell County, Lexington County, Orangeburg County, Richland County.
- Columbia (part)
- Aiken
- North Augusta (part)
- Lexington
- West Columbia
- Cayce (part)
- Irmo
- Forest Acres (part)
- St. Andrews (part)
- Seven Oaks
- Dentsville (part)
- Batesburg-Leesville (part)
- Oak Grove
- Blythewood (part)
- Barnwell
- Red Bank
- Woodfield
- Lake Murray of Richland
- White Knoll
- Burnettown
- Williston
- Springdale
- South Congaree
- New Ellenton
- Pine Ridge
- Belvedere
- Blackville
- Capitol View (part)
- Chapin
- Clearwater
- Gaston
- Jackson
- Graniteville
- Gloverville
- Arcadia Lakes (part)
- Swansea
- North
- Pelion
- Wagener
- Langley
- and 21 more
Sources: Census Bureau, FEC, state election offices, Clerk of the House; 2026 results as of November 21, 2026.