Oregon's 4th District
Home to 712,690 people in all of Eugene, Springfield and Corvallis and 78 other places across 8 counties. Represented by Val T. Hoyle (D), projected to win re-election.
2026 election
Projected winner: Val Hoyle
95% of the vote counted as of Nov 21, 2026. One other candidate got 0.1%. Full race →
Earlier results: 2024, 2022
Since the lines were redrawn for 2022.
2024
One other candidate got 0.1%.
2022
One other candidate got 0.1%.
Your representative
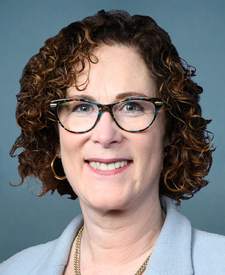
Hoyle's most recent votes
Who lives here
Compared with every congressional district.
- Median household income$69,445
Lower than 76% of districts. Oregon $85,220, U.S. $81,604.
- Adults with a bachelor's degree or higher33.2%
Lower than 56% of districts. Oregon 37.8%, U.S. 36.8%.
- Median age42.6 years
Higher than 85% of districts. Oregon 40.8 years, U.S. 39.2 years.
- Living below the poverty line15.7%
Higher than 82% of districts. Oregon 11.8%, U.S. 12.1%.
- Hispanic or Latino10.1%
Lower than 64% of districts. Oregon 15.5%, U.S. 20.0%.
- Born outside the U.S.5.3%
Lower than 81% of districts. Oregon 10.0%, U.S. 14.8%.
All demographics 6 more
- Population712,690
Lower than 94% of districts. Oregon 4,272,371, U.S. 340,110,990.
- Veterans (adults)8.3%
Higher than 88% of districts. Oregon 6.8%, U.S. 5.9%.
- White, not Hispanic78.4%
Higher than 82% of districts. Oregon 70.1%, U.S. 56.3%.
- Black, not Hispanic1.0%
Lower than 97% of districts. Oregon 1.8%, U.S. 11.7%.
- Asian, not Hispanic2.7%
Lower than 62% of districts. Oregon 4.8%, U.S. 6.2%.
- Other races or more than one, not Hispanic7.8%
Higher than 88% of districts. Oregon 7.6%, U.S. 5.8%.
Dots rank OR-4 among 435 districts. Census ACS 2024 ↗
Places in the district
Benton County, Coos County, Curry County, Douglas County, Lane County, Lincoln County, Linn County, Polk County.
- Eugene
- Springfield
- Corvallis
- Albany (part)
- Roseburg
- Coos Bay
- Cottage Grove
- North Bend
- Newport
- Lincoln City
- Florence
- Sutherlin
- Junction City
- Brookings
- Creswell
- Winston
- Philomath
- Veneta
- Santa Clara
- Reedsport
- Coquille
- Toledo
- River Road
- Bandon
- Oakridge
- Green
- Myrtle Point
- Gold Beach
- Waldport
- Lakeside
- Roseburg North
- Depoe Bay
- Dunes City
- Coburg
- Siletz
- Lowell
- Drain
- Port Orford
- Yoncalla
- Harbor
- and 41 more
Sources: Census Bureau, FEC, state election offices, Clerk of the House; 2026 results as of November 21, 2026.