Montana's 1st District
Home to 579,075 people in all of Missoula, Bozeman and Butte-Silver Bow (balance) and 191 other places across 16 counties. Represented by Ryan K. Zinke (R) until January; Sam Forstag (D) is the projected winner of the 2026 election.
2026 election
Open seat. Zinke is retiring.
Projected winner: Sam Forstag
90% of the vote counted as of Nov 21, 2026. Full race →
Earlier results: 2024, 2022
Since the lines were redrawn for 2022.
2024
2022
Your representative
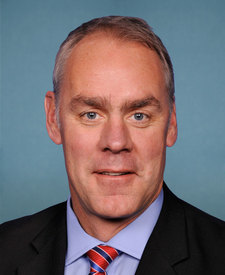
Rep. Ryan K. Zinke
Republican · in the House since 2023
Leaving in January: retiringZinke's most recent votes
Who lives here
Compared with every congressional district.
- Median household income$77,017
Lower than 57% of districts. Montana $75,340, U.S. $81,604.
- Adults with a bachelor's degree or higher41.0%
Higher than 71% of districts. Montana 36.3%, U.S. 36.8%.
- Median age41.2 years
Higher than 72% of districts. Montana 41.3 years, U.S. 39.2 years.
- Living below the poverty line10.2%
Lower than 67% of districts. Montana 10.2%, U.S. 12.1%.
- Hispanic or Latino4.8%
Lower than 88% of districts. Montana 4.9%, U.S. 20.0%.
- Born outside the U.S.2.6%
Lower than 96% of districts. Montana 2.1%, U.S. 14.8%.
All demographics 6 more
- Population579,075
Lower than 99% of districts. Montana 1,137,233, U.S. 340,110,990.
- Veterans (adults)8.0%
Higher than 85% of districts. Montana 8.4%, U.S. 5.9%.
- White, not Hispanic85.0%
Higher than 91% of districts. Montana 83.3%, U.S. 56.3%.
- Black, not Hispanic0.2%
Lowest of all districts. Montana 0.3%, U.S. 11.7%.
- Asian, not Hispanic1.0%
Lower than 92% of districts. Montana 0.8%, U.S. 6.2%.
- Other races or more than one, not Hispanic9.1%
Higher than 95% of districts. Montana 10.8%, U.S. 5.8%.
Dots rank MT-1 among 435 districts. Census ACS 2024 ↗
Places in the district
Beaverhead County, Deer Lodge County, Flathead County, Gallatin County, Glacier County, Granite County, Lake County, Lincoln County, Madison County, Mineral County, Missoula County, Pondera County, Powell County, Ravalli County, Sanders County, Silver Bow County.
- Missoula
- Bozeman
- Butte-Silver Bow (balance)
- Kalispell
- Belgrade
- Anaconda-Deer Lodge County
- Whitefish
- Columbia Falls
- Polson
- Hamilton
- Dillon
- Evergreen
- Cut Bank
- Deer Lodge
- Libby
- Four Corners
- Orchard Homes
- Manhattan
- Bigfork
- Stevensville
- Three Forks
- Ronan
- Lolo
- Big Sky
- Eureka
- Thompson Falls
- West Yellowstone
- Plains
- Lakeside
- North Browning
- Browning
- East Missoula
- Ennis
- Pablo
- Philipsburg
- Superior
- Pinesdale
- Troy
- South Browning
- Frenchtown
- and 154 more
Sources: Census Bureau, FEC, state election offices, Clerk of the House; 2026 results as of November 21, 2026.