Massachusetts' 1st District
Home to 779,993 people in all of Springfield, Chicopee and Pittsfield and 38 other places across 5 counties. Represented by Richard E. Neal (D), projected to win re-election.
2026 election
Projected winner: Richard E. Neal
86% of the vote counted as of Nov 21, 2026. Full race →
Earlier results: 2024, 2022
Since the lines were redrawn for 2022.
2024
One other candidate got 0.3%.
2022
One other candidate got 0.1%.
Your representative
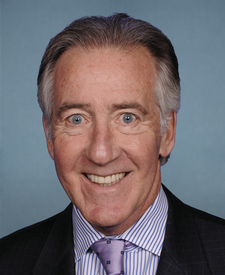
Neal's most recent votes
Who lives here
Compared with every congressional district.
- Median household income$75,462
Lower than 61% of districts. Massachusetts $104,828, U.S. $81,604.
- Adults with a bachelor's degree or higher32.7%
Lower than 58% of districts. Massachusetts 48.3%, U.S. 36.8%.
- Median age41.5 years
Higher than 76% of districts. Massachusetts 40.1 years, U.S. 39.2 years.
- Living below the poverty line13.8%
Higher than 71% of districts. Massachusetts 9.7%, U.S. 12.1%.
- Hispanic or Latino20.2%
Higher than 65% of districts. Massachusetts 14.0%, U.S. 20.0%.
- Born outside the U.S.8.3%
Lower than 62% of districts. Massachusetts 18.7%, U.S. 14.8%.
All demographics 6 more
- Population779,993
Higher than 51% of districts. Massachusetts 7,136,171, U.S. 340,110,990.
- Veterans (adults)5.7%
Lower than 55% of districts. Massachusetts 3.9%, U.S. 5.9%.
- White, not Hispanic67.5%
Higher than 65% of districts. Massachusetts 65.0%, U.S. 56.3%.
- Black, not Hispanic5.3%
Lower than 58% of districts. Massachusetts 6.3%, U.S. 11.7%.
- Asian, not Hispanic2.6%
Lower than 63% of districts. Massachusetts 7.6%, U.S. 6.2%.
- Other races or more than one, not Hispanic4.5%
Lower than 71% of districts. Massachusetts 7.0%, U.S. 5.8%.
Dots rank MA-1 among 435 districts. Census ACS 2024 ↗
Places in the district
Berkshire County, Franklin County, Hampden County, Hampshire County, Worcester County.
- Springfield
- Chicopee
- Pittsfield
- Westfield
- Holyoke
- West Springfield
- Agawam
- Southbridge
- Easthampton
- North Adams
- Palmer
- Longmeadow
- Webster (part)
- Ware
- Oxford
- Spencer
- Adams
- Williamstown
- Wilbraham
- Belchertown
- Fiskdale
- Sturbridge
- North Brookfield
- Great Barrington
- Monson Center
- Lee
- Lenox
- Holland
- West Brookfield
- Warren
- Granby
- East Brookfield
- Housatonic
- Huntington
- Brookfield
- West Warren
- Russell
- Chester
- Cheshire
- Lenox Dale
- and 1 more
Sources: Census Bureau, FEC, state election offices, Clerk of the House; 2026 results as of November 21, 2026.