Kentucky's 6th District
Home to 777,299 people in all of Lexington-Fayette, Georgetown and Richmond and 30 other places across 16 counties. Represented by Andy Barr (R) until January; Zach Dembo (D) is the projected winner of the 2026 election.
2026 election
Open seat. Barr won the U.S. Senate race.
Projected winner: Zach Dembo
88% of the vote counted as of Nov 21, 2026. One other candidate got under 0.1%. Full race →
Earlier results: 2024, 2022
Since the lines were redrawn for 2022.
2024
2022
2 other candidates got 3.7% between them.
Your representative
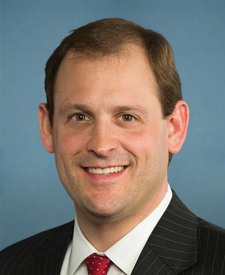
Rep. Andy Barr
Republican · in the House since 2013
Leaving in January: won the U.S. Senate raceBarr's most recent votes
Who lives here
Compared with every congressional district.
- Median household income$68,419
Lower than 78% of districts. Kentucky $64,526, U.S. $81,604.
- Adults with a bachelor's degree or higher38.1%
Higher than 63% of districts. Kentucky 27.9%, U.S. 36.8%.
- Median age37.2 years
Lower than 76% of districts. Kentucky 39.3 years, U.S. 39.2 years.
- Living below the poverty line13.4%
Higher than 68% of districts. Kentucky 15.6%, U.S. 12.1%.
- Hispanic or Latino6.9%
Lower than 76% of districts. Kentucky 5.5%, U.S. 20.0%.
- Born outside the U.S.7.3%
Lower than 68% of districts. Kentucky 5.2%, U.S. 14.8%.
All demographics 6 more
- Population777,299
Higher than 50% of districts. Kentucky 4,588,372, U.S. 340,110,990.
- Veterans (adults)5.2%
Lower than 62% of districts. Kentucky 6.2%, U.S. 5.9%.
- White, not Hispanic77.9%
Higher than 82% of districts. Kentucky 80.3%, U.S. 56.3%.
- Black, not Hispanic7.6%
Higher than 51% of districts. Kentucky 7.0%, U.S. 11.7%.
- Asian, not Hispanic2.5%
Lower than 64% of districts. Kentucky 1.9%, U.S. 6.2%.
- Other races or more than one, not Hispanic5.1%
Lower than 52% of districts. Kentucky 5.3%, U.S. 5.8%.
Dots rank KY-6 among 435 districts. Census ACS 2024 ↗
Places in the district
Anderson County, Bath County, Bourbon County, Clark County, Estill County, Fayette County, Fleming County, Garrard County, Jessamine County, Madison County, Mercer County, Montgomery County, Nicholas County, Powell County, Scott County, Woodford County.
- Lexington-Fayette
- Georgetown
- Richmond
- Nicholasville
- Winchester
- Berea
- Lawrenceburg
- Versailles
- Paris
- Harrodsburg
- Mount Sterling
- Wilmore
- Lancaster
- Stanton
- Flemingsburg
- Irvine
- Carlisle
- Midway
- Jeffersonville
- Clay City
- Camargo
- Burgin
- Stamping Ground
- Millersburg
- North Middletown
- Ravenna
- Sharpsburg (part)
- Sadieville
- Ewing
- Salvisa
- High Bridge
- Keene
- Elizaville
Sources: Census Bureau, FEC, state election offices, Clerk of the House; 2026 results as of November 21, 2026.