Kentucky's 4th District
Home to 776,082 people in all of Covington, Florence and Independence and 104 other places across 21 counties. Represented by Thomas Massie (R) until January; Ed Gallrein (R) is the projected winner of the 2026 election.
2026 election
Open seat. Massie lost the primary.
Projected winner: Ed Gallrein
91% of the vote counted as of Nov 21, 2026. One other candidate got under 0.1%. Full race →
Earlier results: 2024, 2022
Since the lines were redrawn for 2022.
2024
One other candidate got 0.4%.
2022
Your representative
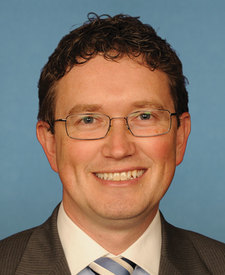
Rep. Thomas Massie
Republican · in the House since 2012
Leaving in January: lost the primaryMassie's most recent votes
Who lives here
Compared with every congressional district.
- Median household income$81,874
Higher than 54% of districts. Kentucky $64,526, U.S. $81,604.
- Adults with a bachelor's degree or higher31.7%
Lower than 61% of districts. Kentucky 27.9%, U.S. 36.8%.
- Median age39.7 years
Higher than 52% of districts. Kentucky 39.3 years, U.S. 39.2 years.
- Living below the poverty line11.7%
Higher than 51% of districts. Kentucky 15.6%, U.S. 12.1%.
- Hispanic or Latino4.8%
Lower than 88% of districts. Kentucky 5.5%, U.S. 20.0%.
- Born outside the U.S.4.0%
Lower than 88% of districts. Kentucky 5.2%, U.S. 14.8%.
All demographics 6 more
- Population776,082
Lower than 52% of districts. Kentucky 4,588,372, U.S. 340,110,990.
- Veterans (adults)6.2%
Higher than 54% of districts. Kentucky 6.2%, U.S. 5.9%.
- White, not Hispanic86.2%
Higher than 93% of districts. Kentucky 80.3%, U.S. 56.3%.
- Black, not Hispanic2.3%
Lower than 82% of districts. Kentucky 7.0%, U.S. 11.7%.
- Asian, not Hispanic1.3%
Lower than 86% of districts. Kentucky 1.9%, U.S. 6.2%.
- Other races or more than one, not Hispanic5.4%
Higher than 54% of districts. Kentucky 5.3%, U.S. 5.8%.
Dots rank KY-4 among 435 districts. Census ACS 2024 ↗
Places in the district
Boone County, Bracken County, Campbell County, Carroll County, Carter County, Gallatin County, Grant County, Greenup County, Harrison County, Henry County, Kenton County, Lewis County, Mason County, Nelson County, Oldham County, Owen County, Pendleton County, Robertson County, Shelby County, Spencer County, Trimble County.
- Covington
- Florence
- Independence
- Erlanger
- Fort Thomas
- Shelbyville
- Newport
- Bardstown (part)
- Alexandria
- La Grange
- Elsmere
- Maysville
- Fort Mitchell
- Edgewood
- Union
- Flatwoods
- Villa Hills
- Burlington
- Taylor Mill
- Highland Heights
- Cynthiana
- Cold Spring
- Crestwood
- Fort Wright
- Dayton
- Bellevue
- Walton
- Prospect (part)
- Ludlow
- Crescent Springs
- Crittenden
- Francisville
- Williamstown
- Carrollton
- Russell
- Oakbrook
- Southgate
- Crestview Hills
- Wilder
- Park Hills
- and 67 more
Sources: Census Bureau, FEC, state election offices, Clerk of the House; 2026 results as of November 21, 2026.