Kentucky's 2nd District
Home to 775,395 people in part of Louisville/Jefferson County, all of Bowling Green and Owensboro and 96 other places across 20 counties. Represented by Brett Guthrie (R), projected to win re-election.
2026 election
Projected winner: Brett Guthrie
86% of the vote counted as of Nov 21, 2026. One other candidate got under 0.1%. Full race →
Earlier results: 2024, 2022
Since the lines were redrawn for 2022.
2024
2022
Your representative
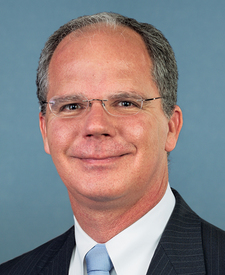
Guthrie's most recent votes
Who lives here
Compared with every congressional district.
- Median household income$68,629
Lower than 77% of districts. Kentucky $64,526, U.S. $81,604.
- Adults with a bachelor's degree or higher24.0%
Lower than 91% of districts. Kentucky 27.9%, U.S. 36.8%.
- Median age39.1 years
Lower than 56% of districts. Kentucky 39.3 years, U.S. 39.2 years.
- Living below the poverty line14.2%
Higher than 74% of districts. Kentucky 15.6%, U.S. 12.1%.
- Hispanic or Latino4.9%
Lower than 87% of districts. Kentucky 5.5%, U.S. 20.0%.
- Born outside the U.S.5.0%
Lower than 83% of districts. Kentucky 5.2%, U.S. 14.8%.
All demographics 6 more
- Population775,395
Lower than 53% of districts. Kentucky 4,588,372, U.S. 340,110,990.
- Veterans (adults)8.1%
Higher than 85% of districts. Kentucky 6.2%, U.S. 5.9%.
- White, not Hispanic82.2%
Higher than 87% of districts. Kentucky 80.3%, U.S. 56.3%.
- Black, not Hispanic4.7%
Lower than 65% of districts. Kentucky 7.0%, U.S. 11.7%.
- Asian, not Hispanic2.6%
Lower than 63% of districts. Kentucky 1.9%, U.S. 6.2%.
- Other races or more than one, not Hispanic5.7%
Higher than 63% of districts. Kentucky 5.3%, U.S. 5.8%.
Dots rank KY-2 among 435 districts. Census ACS 2024 ↗
Places in the district
Barren County, Breckinridge County, Bullitt County, Butler County, Daviess County, Edmonson County, Grayson County, Green County, Hancock County, Hardin County, Hart County, Jefferson County, Larue County, Logan County, McLean County, Meade County, Muhlenberg County, Nelson County, Ohio County, Warren County.
- Louisville/Jefferson County (part)
- Bowling Green
- Owensboro
- Elizabethtown
- Radcliff
- Mount Washington
- Glasgow
- Shepherdsville
- Bardstown (part)
- Middletown (part)
- Hillview
- Vine Grove
- Leitchfield
- Central City
- Greenville
- Beaver Dam
- Hodgenville
- Fort Knox
- Brandenburg
- Pioneer Village
- Hartford
- Morgantown
- Hardinsburg
- Cave City
- Horse Cave
- Greensburg
- Lewisport
- Lebanon Junction
- Munfordville
- Auburn (part)
- Irvington
- Livermore
- Rineyville
- Cloverport
- Muldraugh
- Hawesville
- Hebron Estates
- Brooks
- West Point
- Clarkson
- and 59 more
Sources: Census Bureau, FEC, state election offices, Clerk of the House; 2026 results as of November 21, 2026.