Illinois' 15th District
Home to 739,197 people in parts of Springfield and Decatur, all of Quincy and 349 other places across 35 counties. Represented by Mary E. Miller (R), projected to win re-election.
2026 election
Projected winner: Mary Miller
89% of the vote counted as of Nov 21, 2026. Full race →
Earlier results: 2024, 2022
Since the lines were redrawn for 2022.
2024
One other candidate got 0.5%.
2022
Your representative
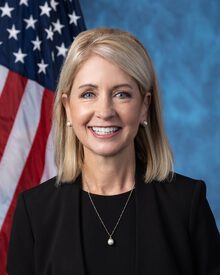
Miller's most recent votes
Who lives here
Compared with every congressional district.
- Median household income$74,855
Lower than 63% of districts. Illinois $83,211, U.S. $81,604.
- Adults with a bachelor's degree or higher27.6%
Lower than 76% of districts. Illinois 39.2%, U.S. 36.8%.
- Median age43.6 years
Higher than 92% of districts. Illinois 39.4 years, U.S. 39.2 years.
- Living below the poverty line9.9%
Lower than 70% of districts. Illinois 11.6%, U.S. 12.1%.
- Hispanic or Latino3.3%
Lower than 95% of districts. Illinois 19.4%, U.S. 20.0%.
- Born outside the U.S.2.1%
Lower than 97% of districts. Illinois 15.4%, U.S. 14.8%.
All demographics 6 more
- Population739,197
Lower than 85% of districts. Illinois 12,710,158, U.S. 340,110,990.
- Veterans (adults)7.3%
Higher than 75% of districts. Illinois 4.5%, U.S. 5.9%.
- White, not Hispanic88.9%
Higher than 98% of districts. Illinois 57.1%, U.S. 56.3%.
- Black, not Hispanic2.6%
Lower than 80% of districts. Illinois 12.9%, U.S. 11.7%.
- Asian, not Hispanic0.9%
Lower than 93% of districts. Illinois 6.3%, U.S. 6.2%.
- Other races or more than one, not Hispanic4.2%
Lower than 77% of districts. Illinois 4.2%, U.S. 5.8%.
Dots rank IL-15 among 435 districts. Census ACS 2024 ↗
Places in the district
Adams County, Bond County, Brown County, Calhoun County, Cass County, Champaign County, Christian County, Coles County, De Witt County, Douglas County, Edgar County, Fayette County, Fulton County, Greene County, Hancock County, Henderson County, Jersey County, Logan County, Macon County, Madison County, Mason County, McDonough County, Menard County, Mercer County, Montgomery County, Morgan County, Moultrie County, Piatt County, Pike County, Sangamon County, Schuyler County, Scott County, Shelby County, Vermilion County, Warren County.
- Springfield (part)
- Decatur (part)
- Quincy
- Edwardsville (part)
- Alton (part)
- Collinsville (part)
- Godfrey (part)
- Jacksonville
- Charleston (part)
- Mattoon (part)
- Macomb (part)
- Lincoln
- Troy
- Taylorville
- Highland
- Mahomet
- Jerseyville
- Paris
- Maryville (part)
- Vandalia
- Greenville
- Clinton
- Litchfield
- Mount Zion
- Beardstown
- Monticello (part)
- Hillsboro
- Pana
- Shelbyville
- Sherman
- Tuscola
- Sullivan
- Pittsfield
- St. Joseph
- Aledo
- Tolono (part)
- Riverton
- South Jacksonville
- Georgetown
- Rushville
- and 312 more
Sources: Census Bureau, FEC, state election offices, Clerk of the House; 2026 results as of November 21, 2026.