Florida's 20th Congressional District: Map, Representative, Demographics
This page describes the district as drawn for 2023–2026. New lines take effect for the 2026 election.
Counties in this district
- Broward County
- Palm Beach County
Find your district on the district map.
Your representatives
FL-20 — No current representative — a vacancy.
 Ashley Moody Republican · U.S. SenatorFull profile →
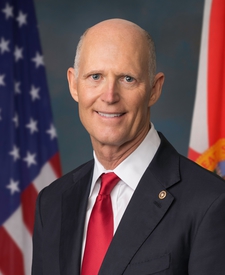 Rick Scott Republican · U.S. SenatorFull profile →
2026 elections
Election day is Tuesday, Nov. 3, 2026.
Past results
2022 general election
| Candidate | Party | Votes | Percent |
|---|---|---|---|
| Sheila Cherfilus-McCormickWinner | D | 136,215 | 72.31% |
| Drew Montez Clark | R | 52,151 | 27.69% |
2020 general election
Held under different district lines
| Candidate | Party | Votes | Percent |
|---|---|---|---|
| Alcee L. HastingsWinner | D | 253,661 | 78.68% |
| Greg Musselwhite | R | 68,748 | 21.32% |
Demographics
| Measure | This district | Florida | United States |
|---|---|---|---|
| Population | 818,131 | 23,372,215 | 340,110,990 |
| Median age (years) | 40.0 | 42.7 | 39.2 |
| Median household income | $70,263 | $77,735 | $81,604 |
| Below poverty level | 14.7% | 12.0% | 12.1% |
| Bachelor's degree or higher (age 25+) | 27.8% | 35.8% | 36.8% |
| Race and ethnicity | |||
| Hispanic or Latino (of any race) | 27.0% | 28.7% | 20.0% |
| Not Hispanic or Latino | |||
| White alone | 17.6% | 49.1% | 56.3% |
| Black or African American alone | 48.1% | 14.3% | 11.7% |
| Asian alone | 2.8% | 3.0% | 6.2% |
| American Indian and Alaska Native alone, Native Hawaiian and Other Pacific Islander alone, Some Other Race alone, Two or More Races | 4.5% | 4.9% | 5.8% |
| Foreign-born | 38.4% | 23.1% | 14.8% |
| Veterans (civilian adults 18+) | 3.4% | 7.0% | 5.9% |
Census estimates. American Community Survey 2024 1-year, Data Profile ↗