Colorado's 7th District
Home to 728,241 people in parts of Arvada and Westminster, all of Lakewood and 57 other places across 12 counties. Represented by Brittany Pettersen (D), projected to win re-election.
2026 election
Projected winner: Brittany Pettersen
96% of the vote counted as of Nov 21, 2026. 2 other candidates got 0.8% between them. Full race →
Earlier results: 2024, 2022
Since the lines were redrawn for 2022.
2024
One other candidate got under 0.1%.
2022
2 other candidates got 0.5% between them.
Your representative
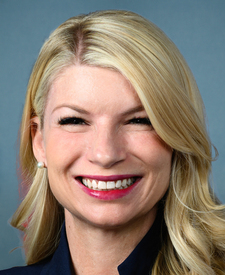
Pettersen's most recent votes
Who lives here
Compared with every congressional district.
- Median household income$104,378
Higher than 85% of districts. Colorado $97,113, U.S. $81,604.
- Adults with a bachelor's degree or higher52.2%
Higher than 91% of districts. Colorado 47.8%, U.S. 36.8%.
- Median age41.1 years
Higher than 71% of districts. Colorado 38.0 years, U.S. 39.2 years.
- Living below the poverty line7.7%
Lower than 87% of districts. Colorado 9.6%, U.S. 12.1%.
- Hispanic or Latino16.1%
Higher than 56% of districts. Colorado 23.2%, U.S. 20.0%.
- Born outside the U.S.6.5%
Lower than 73% of districts. Colorado 10.6%, U.S. 14.8%.
All demographics 6 more
- Population728,241
Lower than 90% of districts. Colorado 5,957,494, U.S. 340,110,990.
- Veterans (adults)6.4%
Higher than 58% of districts. Colorado 7.0%, U.S. 5.9%.
- White, not Hispanic74.1%
Higher than 77% of districts. Colorado 63.6%, U.S. 56.3%.
- Black, not Hispanic1.4%
Lower than 93% of districts. Colorado 4.0%, U.S. 11.7%.
- Asian, not Hispanic3.0%
Lower than 56% of districts. Colorado 3.4%, U.S. 6.2%.
- Other races or more than one, not Hispanic5.3%
Higher than 51% of districts. Colorado 5.8%, U.S. 5.8%.
Dots rank CO-7 among 435 districts. Census ACS 2024 ↗
Places in the district
Adams County, Boulder County, Broomfield County, Chaffee County, Custer County, El Paso County, Fremont County, Jefferson County, Lake County, Park County, Teller County, Weld County.
- Lakewood
- Arvada (part)
- Westminster (part)
- Broomfield (part)
- Wheat Ridge
- Golden
- Cañon City
- Dakota Ridge
- Superior (part)
- Woodland Park
- Salida
- Edgewater
- Florence
- Fairmount
- Evergreen
- Applewood
- Buena Vista
- Leadville
- West Pleasant View
- Lincoln Park
- Penrose
- Genesee
- Park Center
- Cripple Creek
- Poncha Springs
- Leadville North
- Williamsburg
- Fairplay
- Green Mountain Falls
- Silver Cliff
- Indian Hills
- Mountain View
- Kittredge
- Rockvale
- Westcliffe
- Morrison
- Victor
- Coal Creek
- Howard
- Aspen Park
- and 20 more
Sources: Census Bureau, FEC, state election offices, Clerk of the House; 2026 results as of November 21, 2026.