Colorado's 4th District
Home to 789,599 people in parts of Centennial and Loveland, all of Castle Rock and 126 other places across 21 counties. Represented by Lauren Boebert (R) until January; Eileen Laubacher (D) is the projected winner of the 2026 election.
2026 election
Projected winner: Eileen Laubacher
92% of the vote counted as of Nov 21, 2026. One other candidate got under 0.1%. Full race →
Earlier results: 2024, 2022
Since the lines were redrawn for 2022.
2024
One other candidate got 0.3%.
2022
Your representative
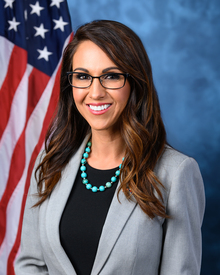
Boebert's most recent votes
Who lives here
Compared with every congressional district.
- Median household income$120,070
Higher than 92% of districts. Colorado $97,113, U.S. $81,604.
- Adults with a bachelor's degree or higher49.4%
Higher than 85% of districts. Colorado 47.8%, U.S. 36.8%.
- Median age39.4 years
Lower than 51% of districts. Colorado 38.0 years, U.S. 39.2 years.
- Living below the poverty line7.3%
Lower than 89% of districts. Colorado 9.6%, U.S. 12.1%.
- Hispanic or Latino16.1%
Higher than 56% of districts. Colorado 23.2%, U.S. 20.0%.
- Born outside the U.S.8.4%
Lower than 62% of districts. Colorado 10.6%, U.S. 14.8%.
All demographics 6 more
- Population789,599
Higher than 61% of districts. Colorado 5,957,494, U.S. 340,110,990.
- Veterans (adults)6.5%
Higher than 60% of districts. Colorado 7.0%, U.S. 5.9%.
- White, not Hispanic72.0%
Higher than 74% of districts. Colorado 63.6%, U.S. 56.3%.
- Black, not Hispanic2.1%
Lower than 85% of districts. Colorado 4.0%, U.S. 11.7%.
- Asian, not Hispanic4.2%
Higher than 56% of districts. Colorado 3.4%, U.S. 6.2%.
- Other races or more than one, not Hispanic5.6%
Higher than 60% of districts. Colorado 5.8%, U.S. 5.8%.
Dots rank CO-4 among 435 districts. Census ACS 2024 ↗
Places in the district
Adams County, Arapahoe County, Baca County, Bent County, Cheyenne County, Crowley County, Douglas County, El Paso County, Elbert County, Kiowa County, Kit Carson County, Larimer County, Lincoln County, Logan County, Morgan County, Phillips County, Prowers County, Sedgwick County, Washington County, Weld County, Yuma County.
- Centennial (part)
- Loveland (part)
- Castle Rock
- Parker
- Littleton (part)
- Highlands Ranch
- Windsor
- Lone Tree
- Sterling
- Fort Morgan
- Wellington
- Castle Pines
- Lamar
- Severance
- Eaton
- Brush
- The Pinery
- Roxborough Park
- Stonegate
- Yuma
- Burlington
- Bennett (part)
- Wray
- Holyoke
- Las Animas
- Limon
- Meridian
- Ault
- Akron
- Castle Pines Village
- Elizabeth
- Hudson (part)
- Wiggins
- Sierra Ridge
- Ponderosa Park
- Springfield
- Strasburg
- Julesburg
- Meridian Village
- Keenesburg
- and 89 more
Sources: Census Bureau, FEC, state election offices, Clerk of the House; 2026 results as of November 21, 2026.