California's 43rd District
Home to 719,690 people in parts of Los Angeles and Torrance, all of Inglewood and 12 other places in Los Angeles County. Represented by Maxine Waters (D).
2026 election
California drew new district lines for 2026.
In 2026 this area votes in CA-43.
Earlier results: 2024, 2022
Since the lines were redrawn for 2022.
2024
2022
Your representative
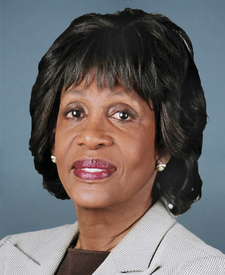
Waters' most recent votes
Who lives here
Compared with every congressional district.
- Median household income$75,336
Lower than 62% of districts. California $100,149, U.S. $81,604.
- Adults with a bachelor's degree or higher22.2%
Lower than 94% of districts. California 38.1%, U.S. 36.8%.
- Median age36.8 years
Lower than 80% of districts. California 38.4 years, U.S. 39.2 years.
- Living below the poverty line17.2%
Higher than 88% of districts. California 11.8%, U.S. 12.1%.
- Hispanic or Latino60.9%
Higher than 94% of districts. California 40.8%, U.S. 20.0%.
- Born outside the U.S.33.7%
Higher than 92% of districts. California 27.6%, U.S. 14.8%.
All demographics 6 more
- Population719,690
Lower than 93% of districts. California 39,431,263, U.S. 340,110,990.
- Veterans (adults)2.6%
Lower than 91% of districts. California 4.0%, U.S. 5.9%.
- White, not Hispanic6.6%
Lowest of all districts. California 32.6%, U.S. 56.3%.
- Black, not Hispanic20.6%
Higher than 85% of districts. California 5.1%, U.S. 11.7%.
- Asian, not Hispanic8.8%
Higher than 80% of districts. California 15.8%, U.S. 6.2%.
- Other races or more than one, not Hispanic3.1%
Lower than 95% of districts. California 5.7%, U.S. 5.8%.
Dots rank CA-43 among 435 districts. Census ACS 2024 ↗
Places in the district
Los Angeles County.
- Los Angeles (part)
- Torrance (part)
- Inglewood
- Compton
- Hawthorne
- Gardena
- Lawndale
- Westmont
- West Rancho Dominguez
- Willowbrook
- Lennox
- East Rancho Dominguez
- Del Aire
- West Athens
- Alondra Park
Sources: Census Bureau, FEC, state election offices, Clerk of the House.