California's 11th District
Home to 729,775 people in part of San Francisco in San Francisco County. Represented by Nancy Pelosi (D) until January.
2026 election
California drew new district lines for 2026.
In 2026 this area votes in CA-11.
Earlier results: 2024, 2022
Since the lines were redrawn for 2022.
2024
2022
Your representative
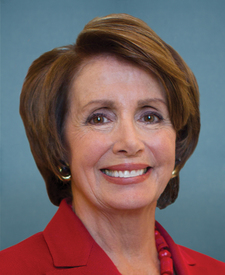
Rep. Nancy Pelosi
Democrat · in the House since 1987
Leaving in January: retiringPelosi's most recent votes
Who lives here
Compared with every congressional district.
- Median household income$142,524
Higher than 98% of districts. California $100,149, U.S. $81,604.
- Adults with a bachelor's degree or higher64.1%
Higher than 98% of districts. California 38.1%, U.S. 36.8%.
- Median age39.7 years
Higher than 52% of districts. California 38.4 years, U.S. 39.2 years.
- Living below the poverty line11.7%
Higher than 51% of districts. California 11.8%, U.S. 12.1%.
- Hispanic or Latino15.7%
Higher than 55% of districts. California 40.8%, U.S. 20.0%.
- Born outside the U.S.32.2%
Higher than 91% of districts. California 27.6%, U.S. 14.8%.
All demographics 6 more
- Population729,775
Lower than 89% of districts. California 39,431,263, U.S. 340,110,990.
- Veterans (adults)2.4%
Lower than 94% of districts. California 4.0%, U.S. 5.9%.
- White, not Hispanic39.5%
Lower than 78% of districts. California 32.6%, U.S. 56.3%.
- Black, not Hispanic4.8%
Lower than 63% of districts. California 5.1%, U.S. 11.7%.
- Asian, not Hispanic32.4%
Higher than 98% of districts. California 15.8%, U.S. 6.2%.
- Other races or more than one, not Hispanic7.6%
Higher than 87% of districts. California 5.7%, U.S. 5.8%.
Dots rank CA-11 among 435 districts. Census ACS 2024 ↗
Places in the district
San Francisco County.
- San Francisco (part)
Sources: Census Bureau, FEC, state election offices, Clerk of the House.